A stormwater detention basin off Green Oaks Boulevard kept failing its infiltration tests last spring. The contractor had compacted to spec, but the basin drained poorly. The grain size distribution told the story: 22% passing the #200 sieve, with a clay fraction near 18%. That hydrometer curve explained the ponding. In Arlington, where residual clays of the Eagle Ford Group mix with alluvial silts in the Trinity River floodplain, visual classification misleads. A complete grain size analysis—sieve plus hydrometer—quantifies the silt and clay fractions that govern permeability, shrink-swell, and frost susceptibility. We run the full stack: ASTM D6913 dry sieving for the coarse fraction, ASTM D422 hydrometer for fines, plus wash procedures per ASTM D1140 when fines coats the coarse particles. The lab also runs parallel Atterberg limits when the hydrometer curve shows a plasticity-sensitive clay fraction. Data feeds directly into USCS classification per ASTM D2487, which IBC Chapter 18 requires for foundation design on Arlington's expansive clay profiles.
A hydrometer curve that ignores temperature correction can overestimate clay content by 4 to 6 percent—enough to misclassify a CL as a CH and trigger unnecessary overexcavation in Arlington's Eagle Ford clays.
Methodology and scope
Arlington sits at roughly 600 feet elevation on the Western Cross Timbers, where the geology shifts from weathered shale to terrace deposits within a few hundred yards. Grain size curves from sites near Lake Arlington routinely show bimodal distributions—coarse sand lenses interbedded with fat clay strata. A single point classification misses that layering. Our analysis combines mechanical sieving from 75 mm down to 75 µm with a hydrometer sedimentation test that reads densities at 15, 30, 60, 120, and 1,440 minutes. The lab reports D10, D30, D50, D60, and D85 in micrometers, computes Cu and Cc coefficients, and overlays the curve on USCS and AASHTO M 145 templates. For pavement subgrade work along Cooper Street, the
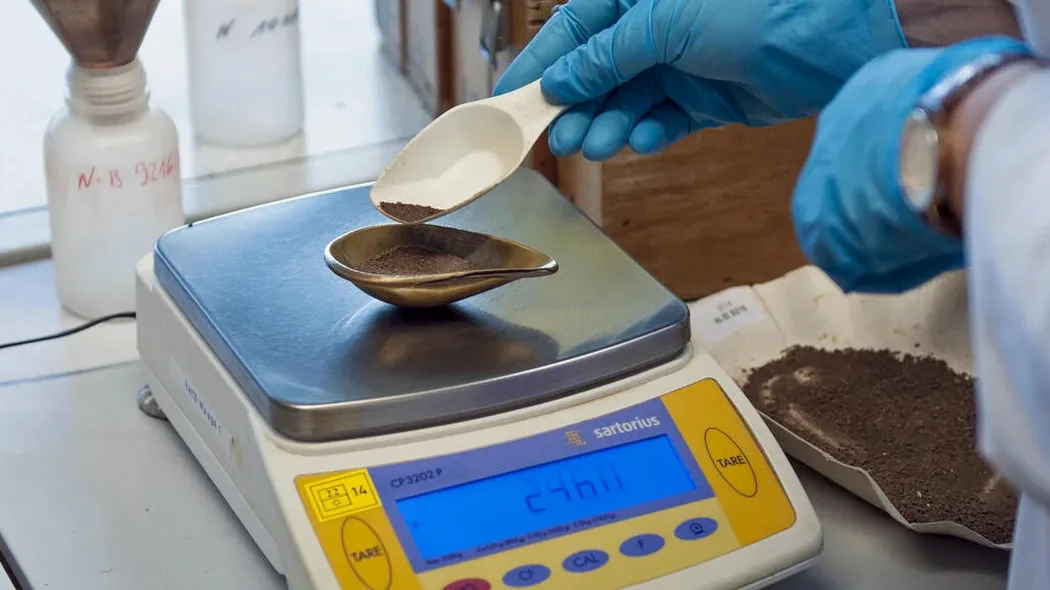
CBR road correlation uses D60 and percent fines to estimate drainage and strength. Every sample is oven-dried at 110°C, weighed to 0.01 g resolution, and dispersed with sodium hexametaphosphate per ASTM D422 Section 6. The hydrometer cylinder sits in a constant-temperature bath at 20°C with temperature corrections logged every reading. We report percent gravel, sand, silt, and clay to one decimal place, plus the coefficient of uniformity and curvature—numbers the City of Arlington Public Works reviewers expect on the geotechnical data sheet.
Local geotechnical context
The costliest assumption in Arlington earthwork is that a tan, stiff soil is a low-plasticity CL. We have seen Eagle Ford shale-derived soils that look sandy in the field but run 35% clay on the hydrometer, with plasticity indices above 30. That misclassification leads to under-designed footings, cracked slabs, and failed pavements. The IBC explicitly ties allowable bearing pressure to the USCS group symbol, and Table 1806.2 defaults to conservative values unless you have a laboratory grain size curve and Atterberg data to justify higher numbers. Stormwater infiltration BMPs are another exposure: the TCEQ Edwards Aquifer rules and City of Arlington Drainage Criteria Manual require a textural classification before crediting infiltration rates. Without the full sieve-plus-hydrometer dataset, the reviewing engineer will default to the lowest infiltration rate in the soil group—often zero for fine-grained soils—forcing oversized detention or underdrain systems that add tens of thousands to the site work budget.
Quick answers
How much does a grain size analysis with hydrometer cost in Arlington?
A complete sieve-plus-hydrometer analysis typically runs between US$90 and US$190 per sample, depending on whether the coarse fraction requires full sieving or just a wash, and whether Atterberg limits are run on the same sample. Volume discounts apply for 10 or more samples from the same project.
Why does the hydrometer test take longer than the sieve analysis?
The hydrometer measures sedimentation velocity, which depends on particle diameter per Stokes' Law. Readings are taken over 24 hours because silt particles settle in minutes, but clay-sized particles (<2 µm) remain suspended for hours. The 1,440-minute reading captures the finest fraction. Temperature control is critical—a 1°C shift changes the hydrometer reading by roughly 0.3 g/L, so the cylinder must sit in a constant-temperature bath throughout the test.
What sample size do you need for a sieve and hydrometer analysis?
We require approximately 500 g of material passing the No. 4 sieve for the hydrometer test alone, plus enough bulk sample to run the full sieve stack. A one-gallon bag of representative soil is sufficient for most Arlington fine-grained soils. For gravelly soils, we may need up to 5 kg to obtain a representative coarse fraction. Samples should be sealed in airtight bags to preserve natural moisture if Atterberg limits are also requested.
How does the grain size curve affect my foundation design?
The USCS group symbol derived from the grain size curve and Atterberg limits determines IBC presumptive bearing values and guides decisions on footing depth, slab-on-grade reinforcement, and drainage. In Arlington's expansive clay zones, a soil classified as CH (fat clay) will typically require deeper footings, moisture-conditioned select fill, or chemical stabilization to mitigate shrink-swell movement. A well-graded sand (SW) with less than 5% fines allows higher bearing pressures and free-draining conditions.